Image List
-

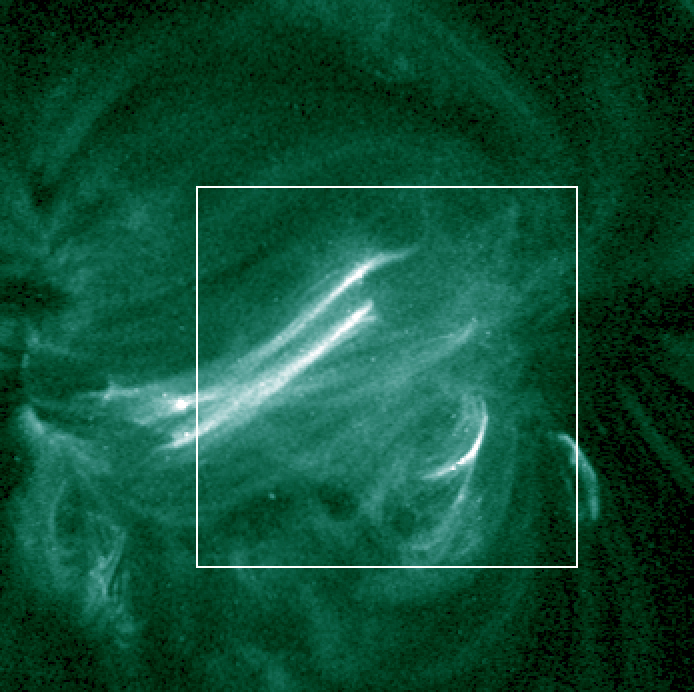
Same as above, with a box showing the field of view of the corresponding IRIS image (top).
NASA/SDO -
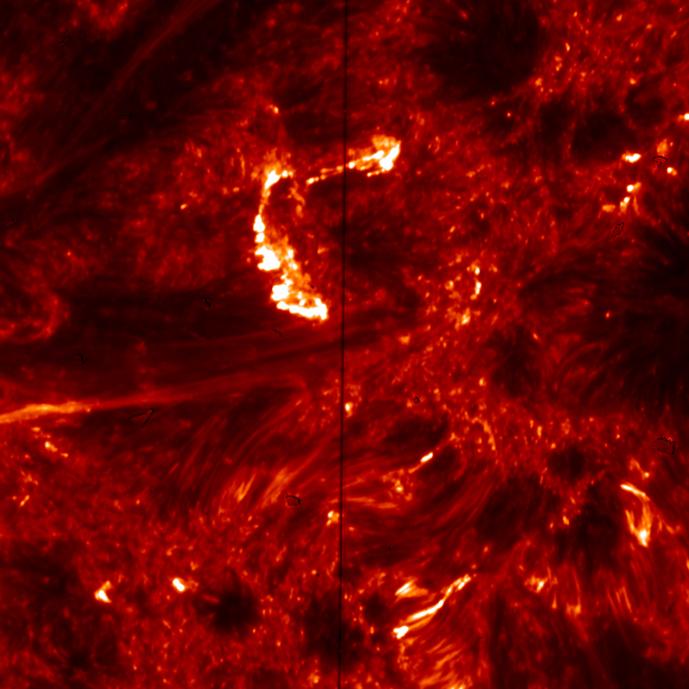
This image from the Atmospheric Imaging Assembly on board NASA's Solar Dynamics Observatory was taken simultaneously with the IRIS observations. It shows emission from hot coronal loops (T > 5 million K) in a solar active region. IRIS observed brightenings occurring at the footpoints of these hot loops. The image is color-coded to show light at a wavelength of 94 Angstroms. The size of each pixel corresponds to about 430 km (270 miles) on the Sun.
NASA/SDO -
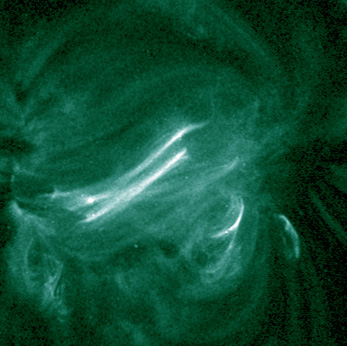
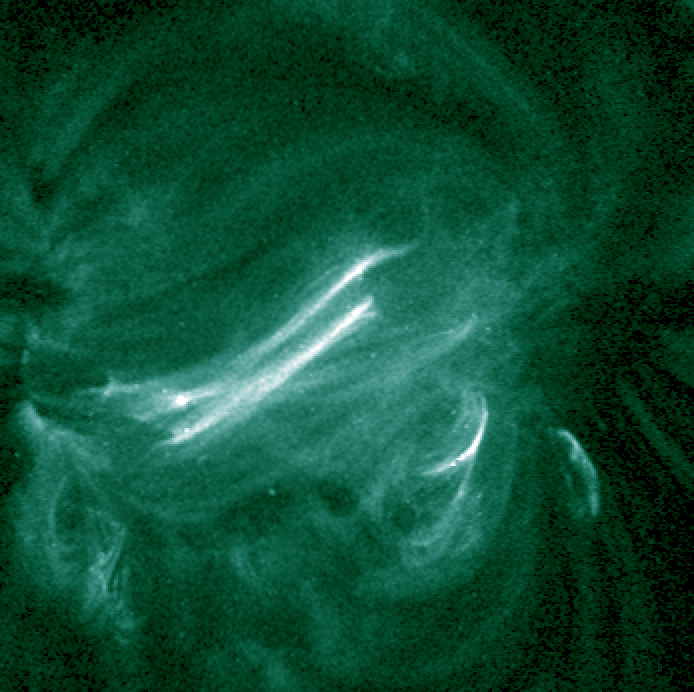
This image from the Interface Region Imaging Spectrograph (IRIS) shows emission from hot plasma (T ~ 80,000-100,000 K) in the Sun's transition region - the atmospheric layer between the surface and the outer corona. The bright, C-shaped feature at upper center shows brightening in the footprints of hot coronal loops, which is created by high-energy electrons accelerated by nanoflares. The vertical dark line corresponds to the slit of the spectrograph. The image is color-coded to show light at a wavelength of 1,400 Angstroms. The size of each pixel corresponds to about 120 km (75 miles) on the Sun.
NASA/IRIS