Image List
-
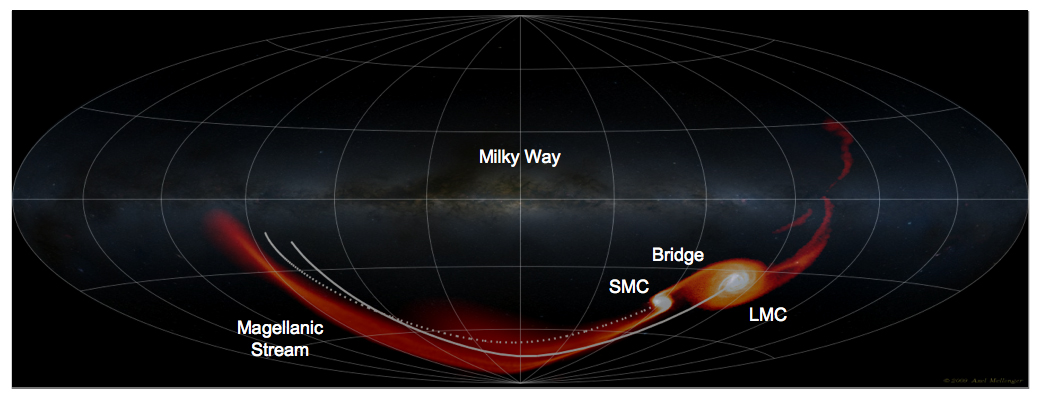
This plot shows the simulated gas distribution of the Magellanic System resulting from the tidal encounter between the Large Magellanic Cloud (LMC) and Small Magellanic Cloud (SMC) as they orbit our home Milky Way Galaxy. The entire sky is plotted in galactocentric coordinates of longitude and latitude. The Magellanic Stream is the pronounced tail of material that stretches 150 degrees across the southern sky. The solid line shows the calculated path of the LMC and the dotted line is the path of the SMC.The color range from dark to light shows the density (lower to higher) of the hydrogen gas making up the Magellanic Stream and the Bridge that connects the two dwarf galaxies.
Plot by G. Besla, Milky Way background image by Axel Mellinger (used with permission)