Image List
-

The Helix Nebula, which is composed of gaseous shells and disks puffed out by a dying sunlike star, exhibits complex structure on the smallest visible scales. In this new image from NASA's Spitzer Space Telescope, infrared light at wavelengths of 3.2, 4.5 and 8.0 microns has been colored blue, green, and red (respectively). The color saturation also has been increased to intensify hues. The "cometary knots" show blue-green heads due to excitation of their molecular material from shocks or ultraviolet radiation. The tails of the cometary knots appear redder due to being shielded from the central star's ultraviolet radiation and wind by the heads of the knots.
NASA / JPL-Caltech / J. Hora (CfA) & W. Latter (NASA/Herschel) -

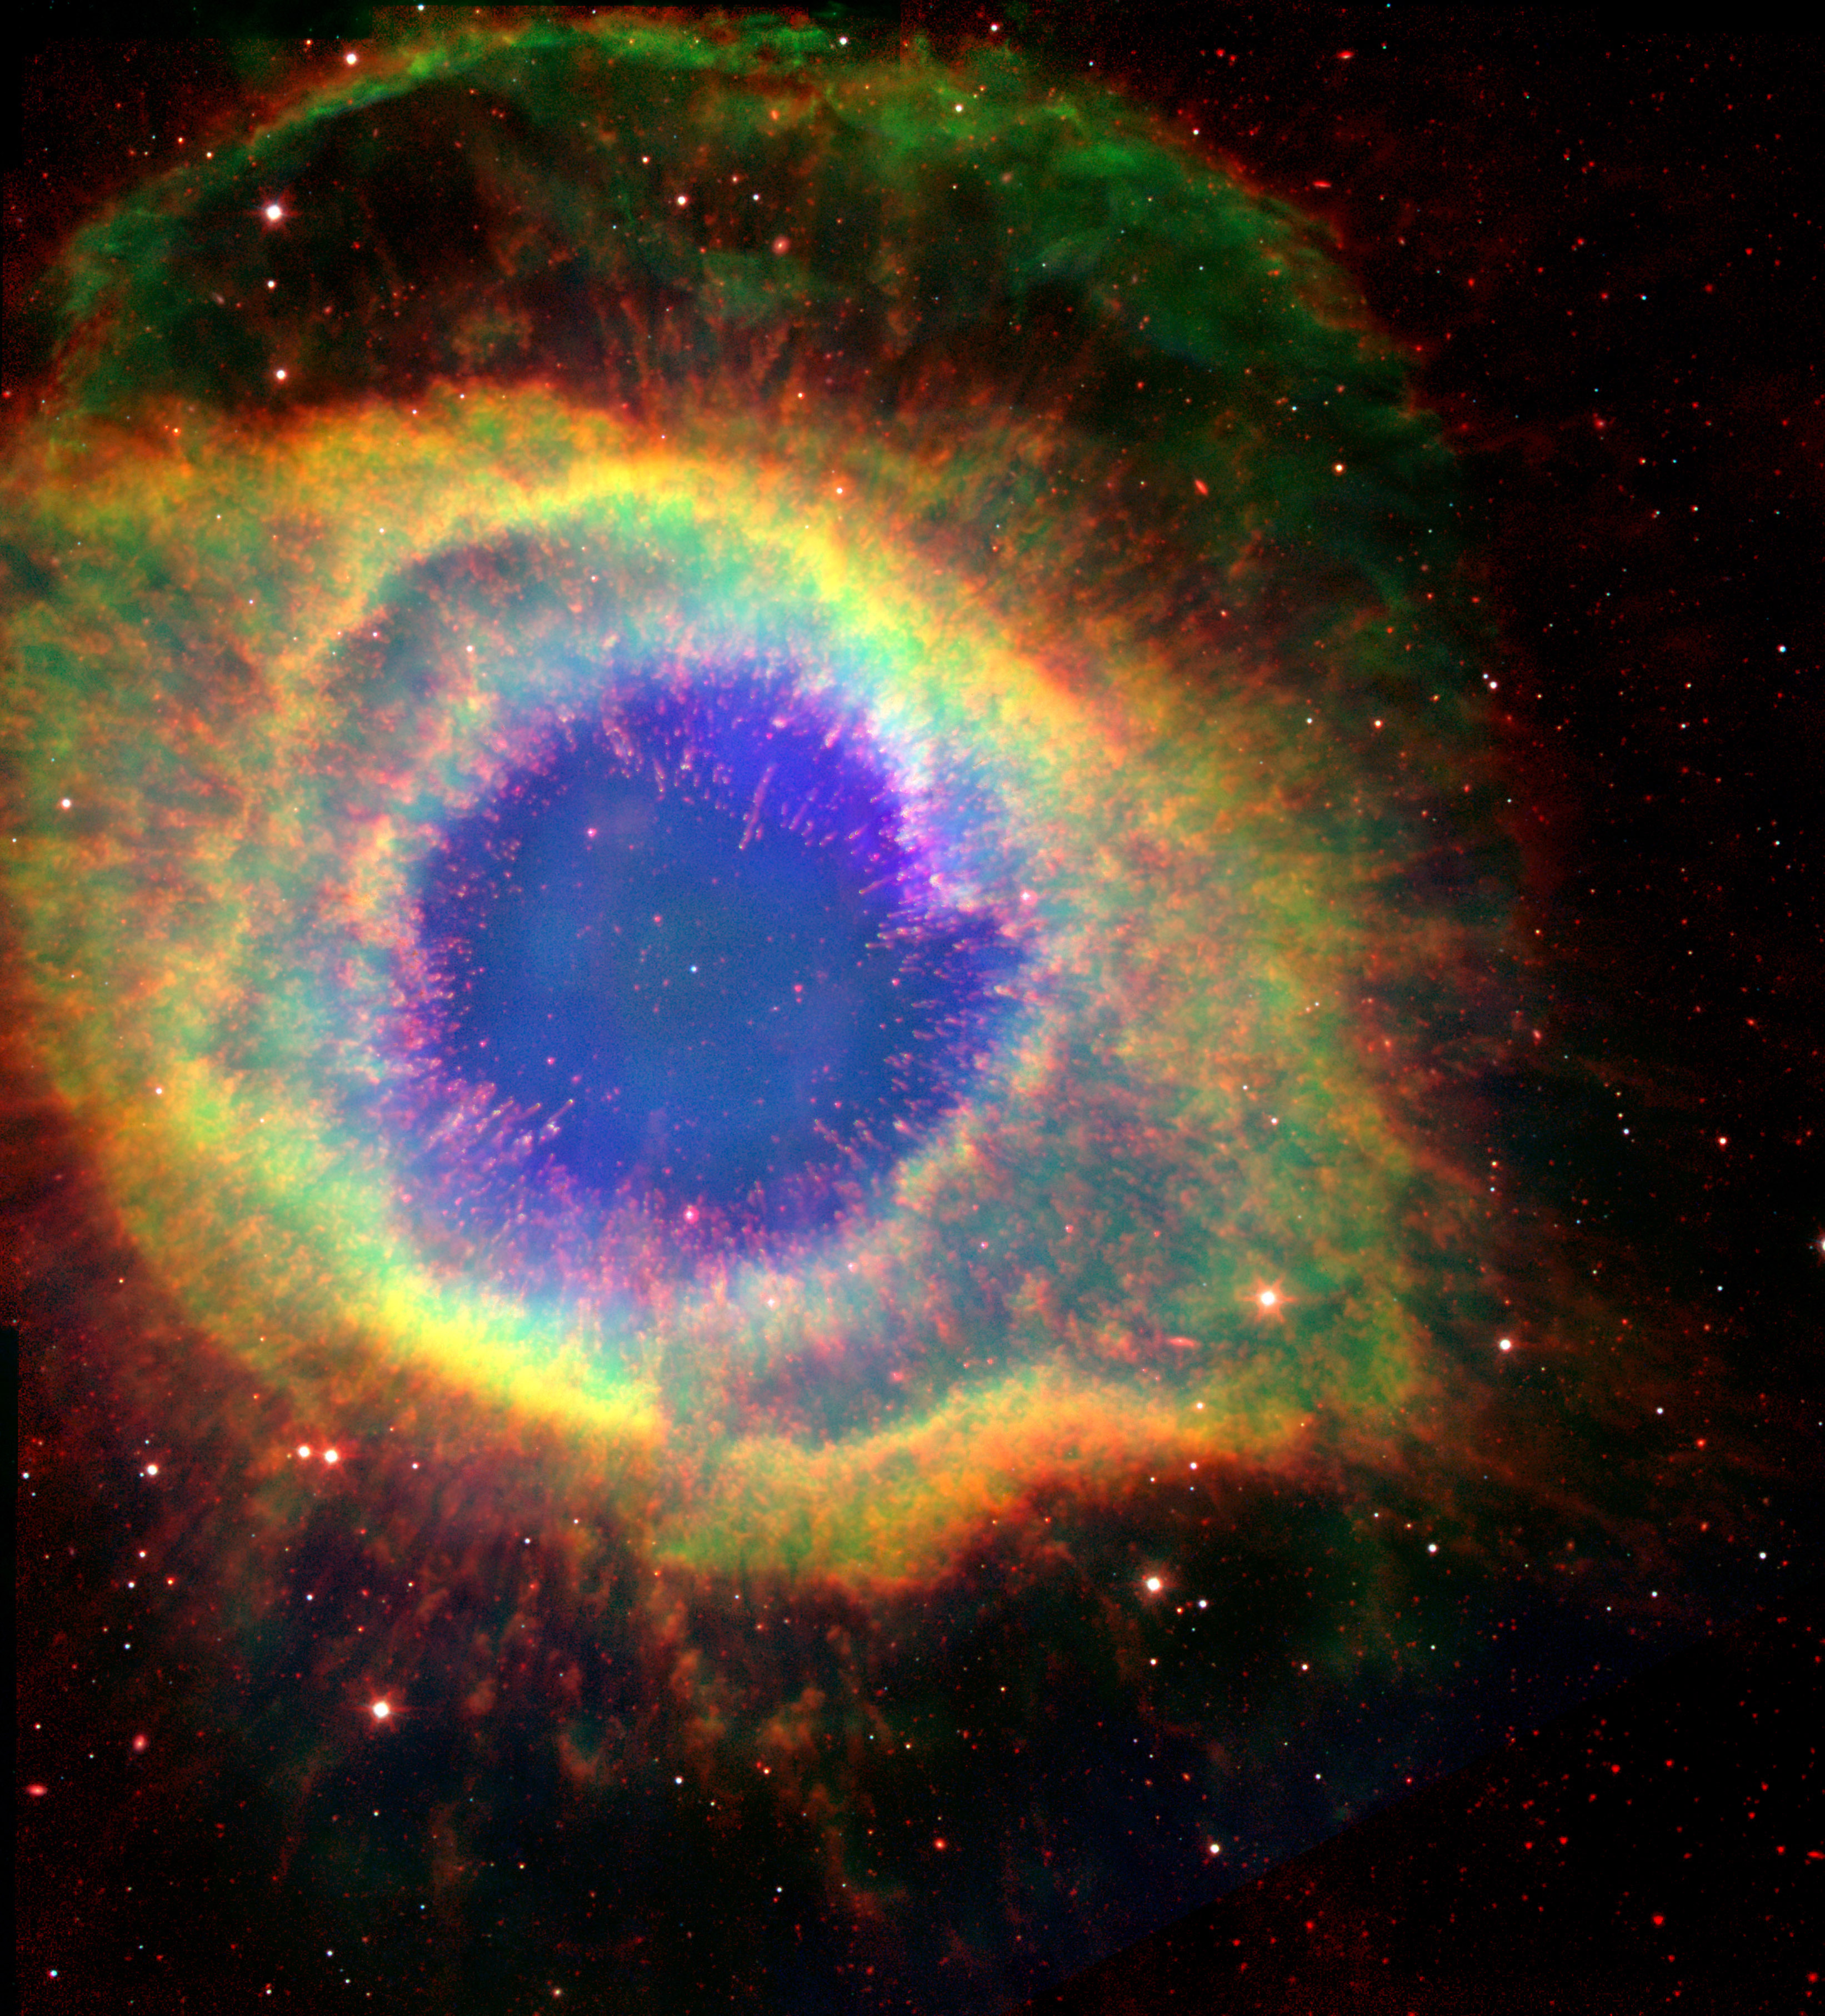
This image is a composite of visible-light data from NASA's Hubble Space Telescope and the Cerro Tololo Inter-American Observatory, shown in blue (for data taken using an O III filter) and green (for data through a hydrogen-alpha filter), with infrared data from Spitzer, shown in red. This image highlights how the Spitzer features, including dust emission at a wavelength of 8 microns, tend to fall outside the regions of greatest optical emission.
NASA / ESA / JPL-Caltech / J. Hora (CfA) & C.R. O'Dell (Vanderbilt)