An Intergalactic Weather Map
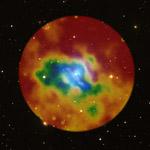
Just like a weather map for a local forecast on Earth, the colored circle depicts variations in temperature across a region. This particular map presents the range of temperature in a region of space as observed by NASA's Chandra X-ray Observatory, with the hotter temperatures shown in red and decreasingly cooler temperatures shown in orange, yellow, green, and blue. The numbers displayed when rolling your mouse over the image give the gas temperature in millions of degrees.
A notable feature of this image is the relatively small variation in temperature across the weather map, with a range of only about 30% across several hundred thousand light years. Without any sources of heat, the densest gas near the center of the map should cool to much lower temperatures as energy is lost because of radiation. However, outbursts generated by the supermassive black hole at the center of NGC 5813 provide heat, preventing the gas near the center of the galaxy from cooling to such low temperatures. This decreases the amount of cool gas available to form new stars. This process is analogous to the Sun providing heat for Earth's atmosphere and preventing water and water vapor from cooling and freezing.