Image List
-

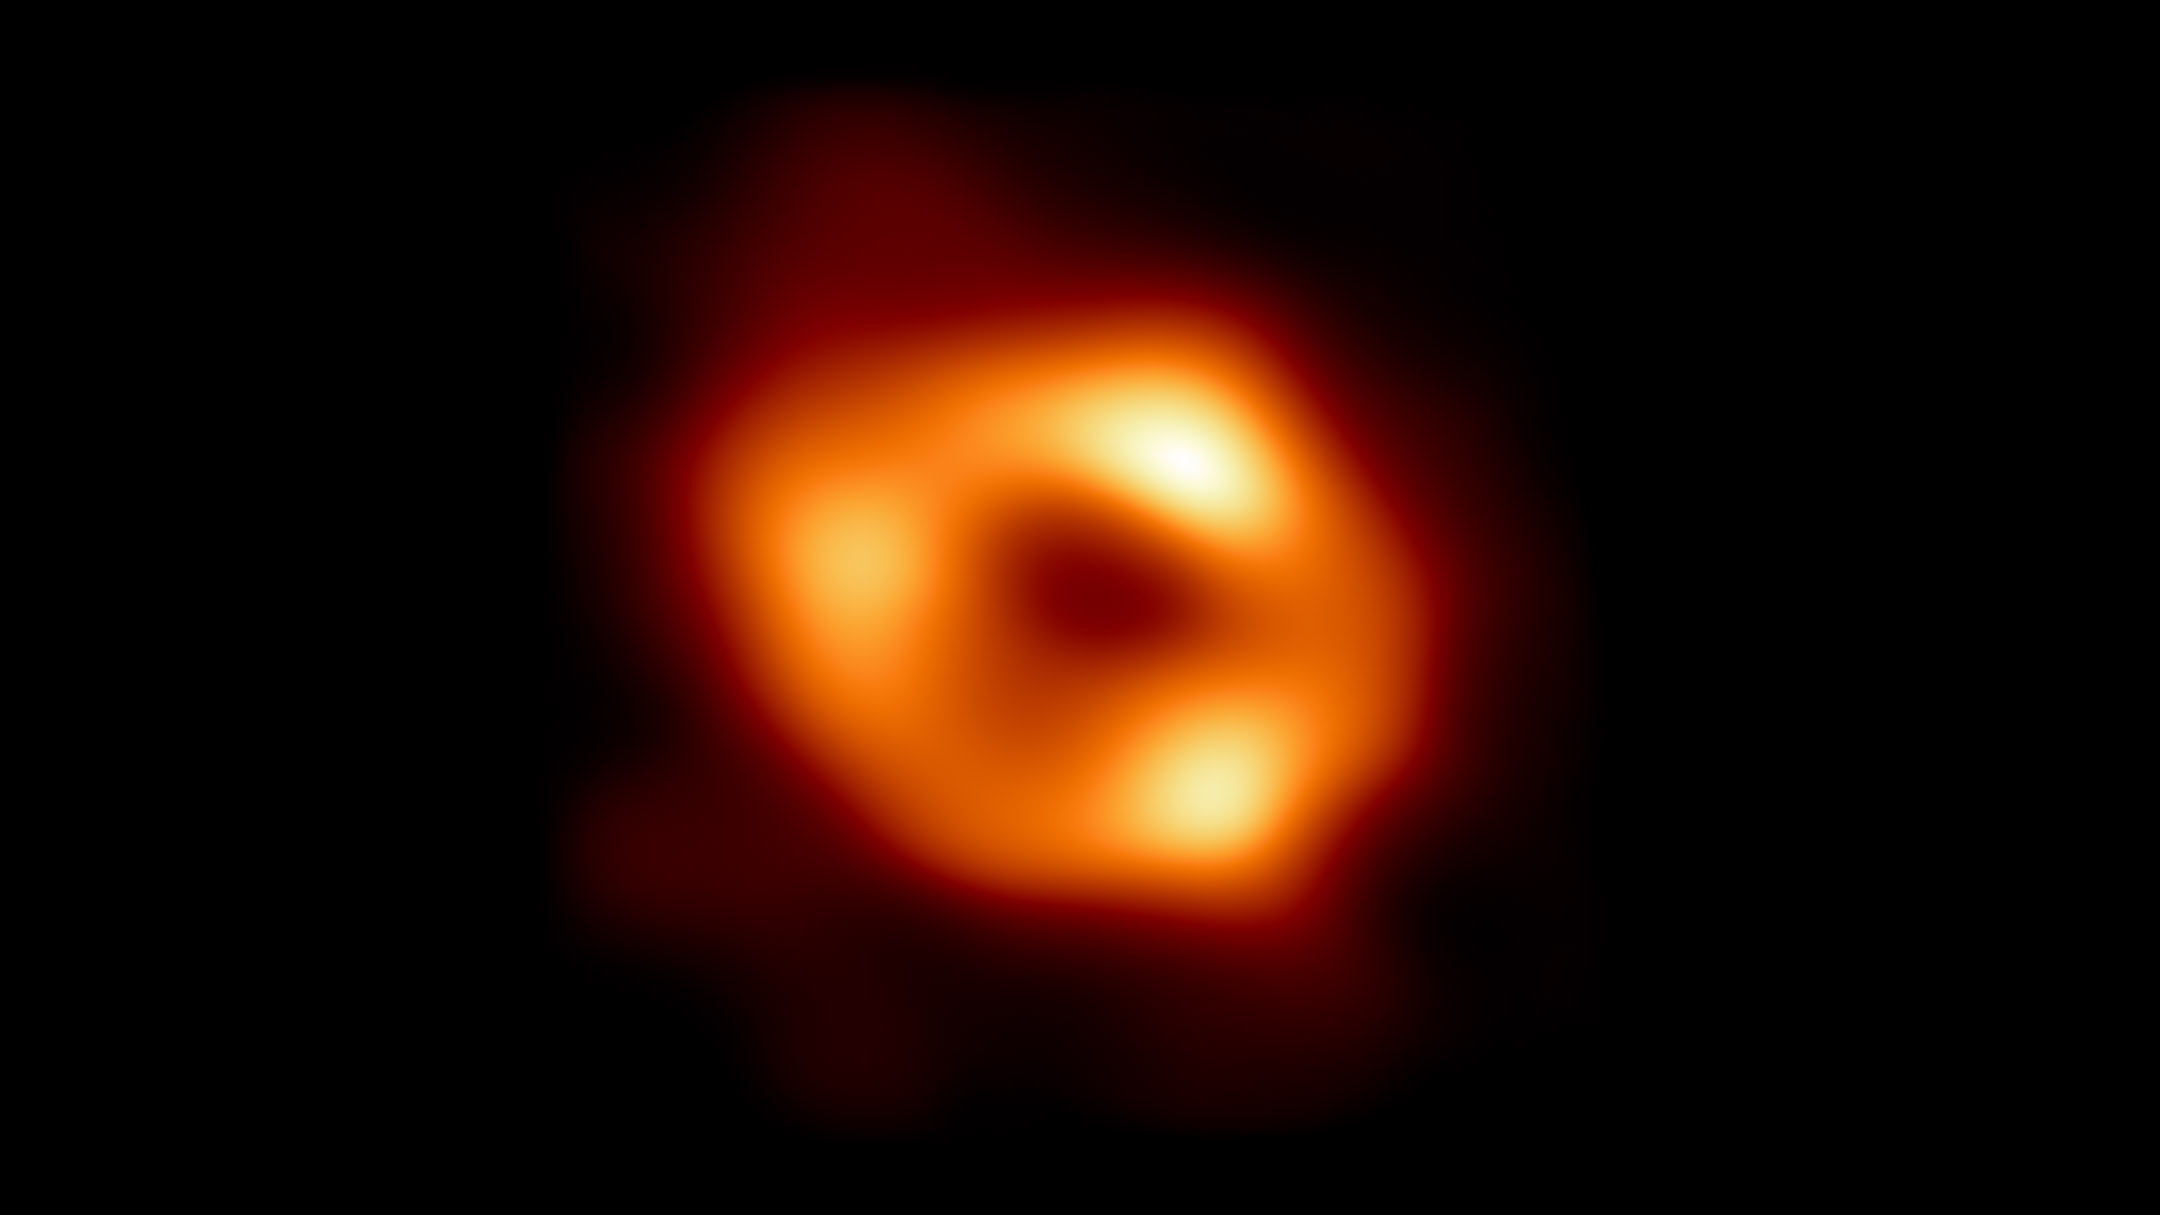
First image of the black hole at the center of the Milky Way
This is the first image of Sagittarius A* (or Sgr A* for short), the supermassive black hole at the center of our galaxy. It's the first direct visual evidence of the presence of this black hole. It was captured by the Event Horizon Telescope (EHT), an array which linked together eight existing radio observatories across the planet to form a single "Earth-sized" virtual telescope. The telescope is named after the "event horizon," the boundary of the black hole beyond which no light can escape.
Although we cannot see the event horizon itself, because it cannot emit light, glowing gas orbiting around the black hole reveals a telltale signature: a dark central region (called a "shadow") surrounded by a bright ring-like structure. The new view captures light bent by the powerful gravity of the black hole, which is four million times more massive than our Sun. The image of the Sgr A* black hole is an average of the different images the EHT Collaboration has extracted from its 2017 observations.
EHT Collaboration -

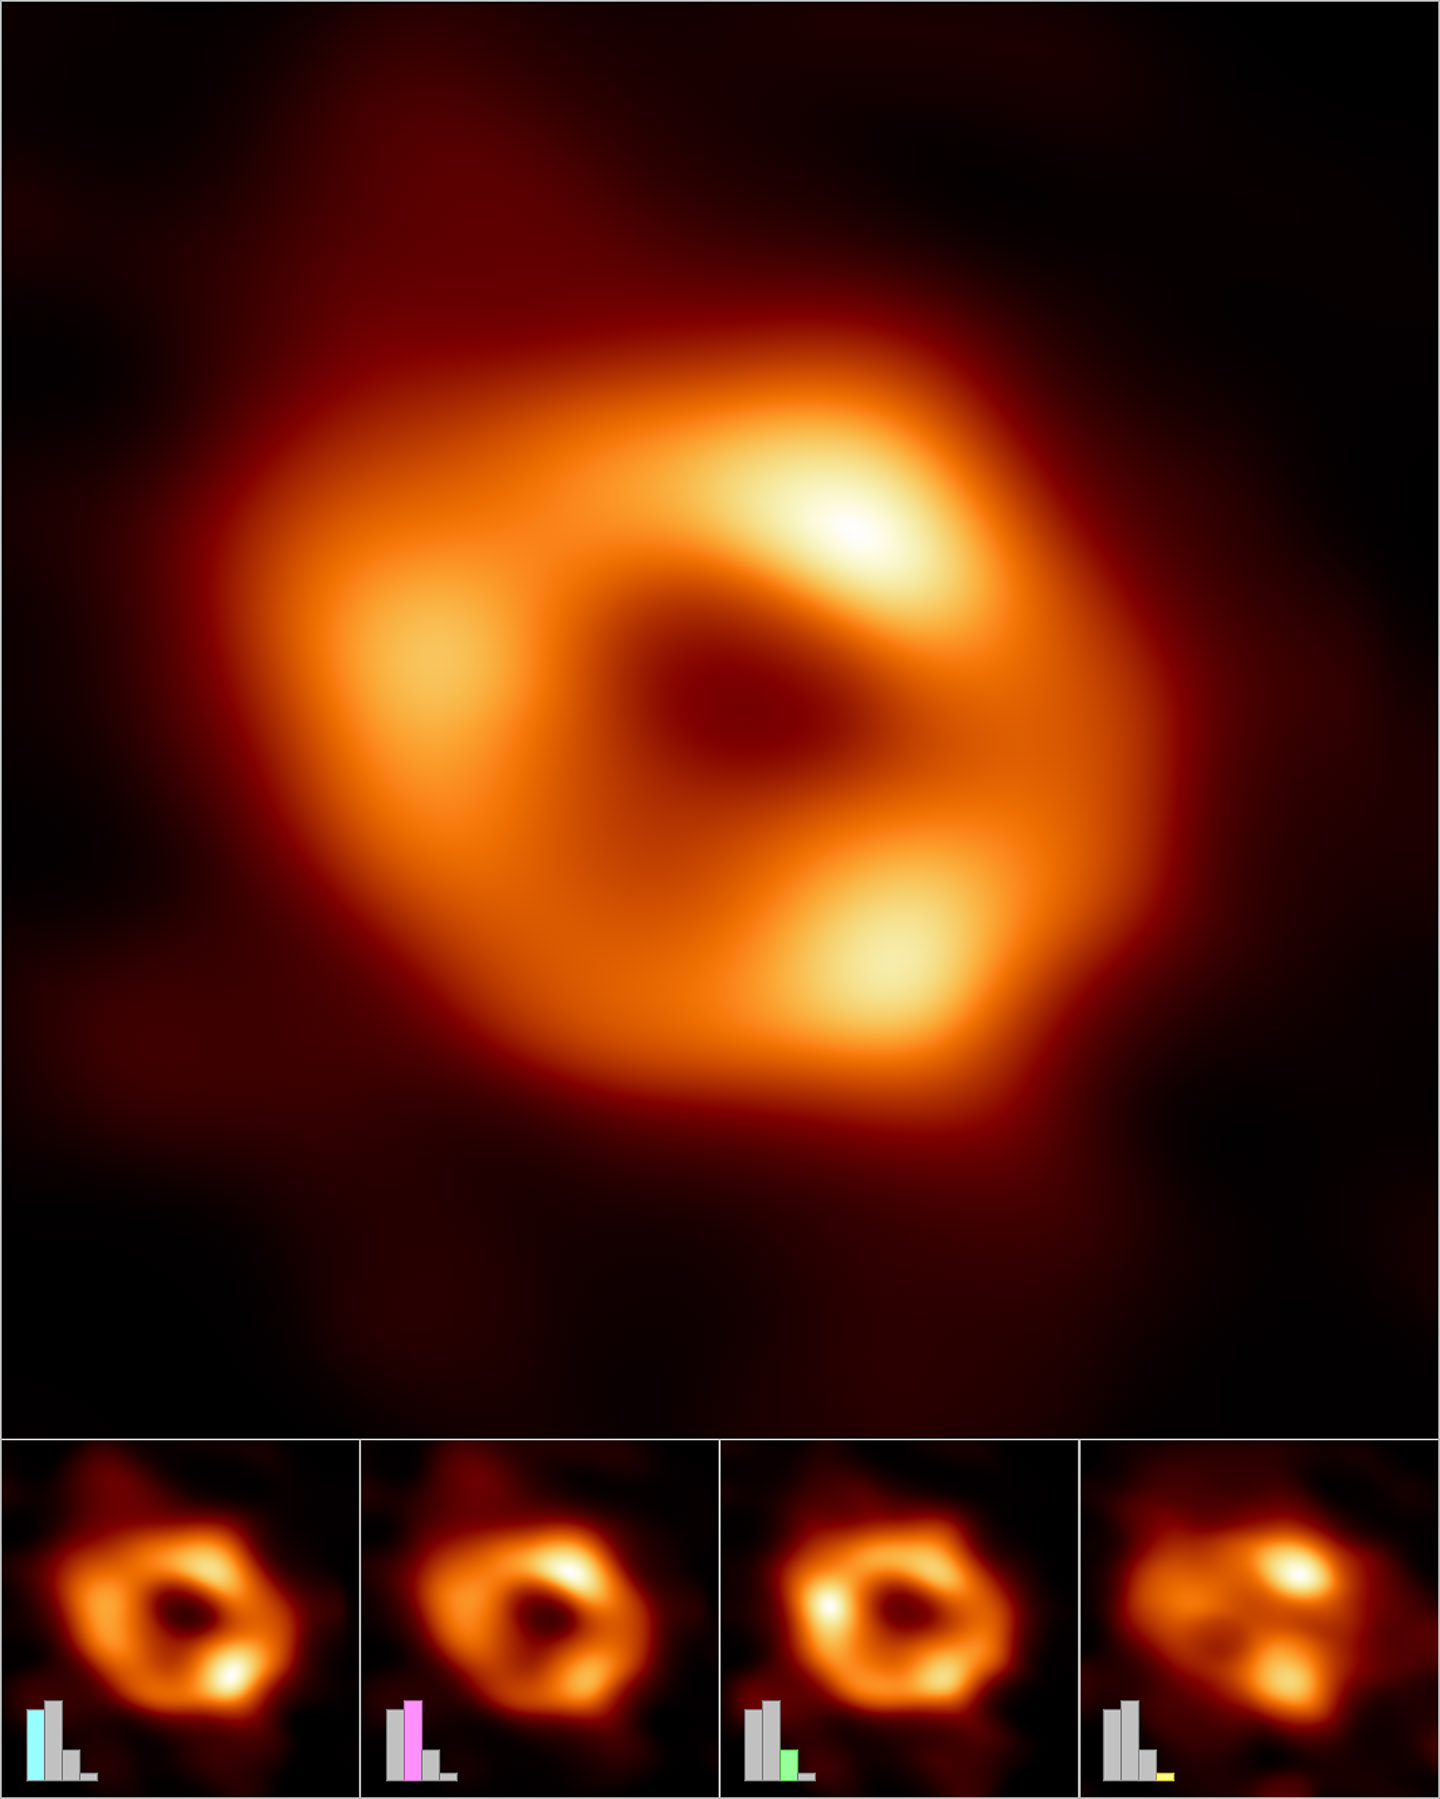
Making of the image of the black hole at the center of the Milky Way
The Event Horizon Telescope (EHT) Collaboration has created a single image (top frame) of the supermassive black hole at the center of our galaxy, called Sagittarius A* (or Sgr A* for short), by combining images extracted from the EHT observations.
The main image was produced by averaging together thousands of images created using different computational methods — all of which accurately fit the EHT data. This averaged image retains features more commonly seen in the varied images, and suppresses features that appear infrequently.
The images can also be clustered into four groups based on similar features. An averaged, representative image for each of the four clusters is shown in the bottom row. Three of the clusters show a ring structure but, with differently distributed brightness around the ring. The fourth cluster contains images that also fit the data but do not appear ring-like.
The bar graphs show the relative number of images belonging to each cluster. Thousands of images fell into each of the first three clusters, while the fourth and smallest cluster contains only hundreds of images. The heights of the bars indicate the relative "weights," or contributions, of each cluster to the averaged image at top.
EHT Collaboration